

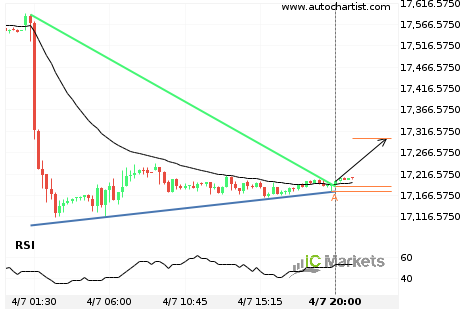
Should we expect a bullish trend on FTSE China A50 Index?
The breakout of FTSE China A50 Index through the resistance line of a Triangle could be a sign of the road ahead. If this breakout persists, we expect the price of FTSE China A50 Index to test 17299.1771 within the next 5 hours. One should always be cautious before placing a trade, wait for confirmation […]
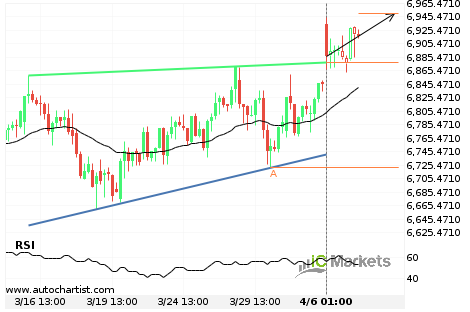
Australia 200 Index has broken through resistance
Australia 200 Index has broken through the resistance line of a Ascending Triangle. It has touched this line at least twice in the last 22 days. This breakout indicates a potential move to 6949.8126 within the next 3 days. Because we have seen it retrace from this positions in the past, one should wait for […]
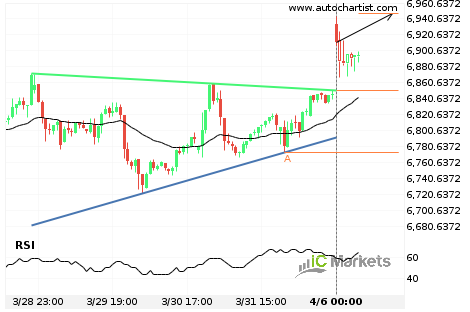
Should we expect a bullish trend on Australia 200 Index?
The breakout of Australia 200 Index through the resistance line of a Triangle could be a sign of the road ahead. If this breakout persists, we expect the price of Australia 200 Index to test 6947.3789 within the next 20 hours. One should always be cautious before placing a trade, wait for confirmation of the […]
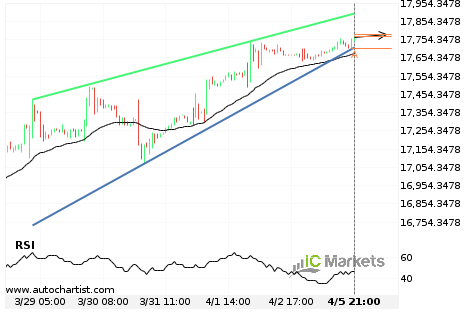
Breach of resistance line imminent by FTSE China A50 Index
FTSE China A50 Index is moving towards the resistance line of a Rising Wedge which it has tested numerous times in the past. We have seen it retrace from this line before, so at this stage it isn’t clear whether it will breach this line or rebound as it did before. If FTSE China A50 […]
Will Australia 200 Index have enough momentum to break resistance?
Australia 200 Index is heading towards the resistance line of a Channel Up and could reach this point within the next 8 hours. It has tested this line numerous times in the past, and this time could be no different from the past, ending in a rebound instead of a breakout. If the breakout doesn’t […]

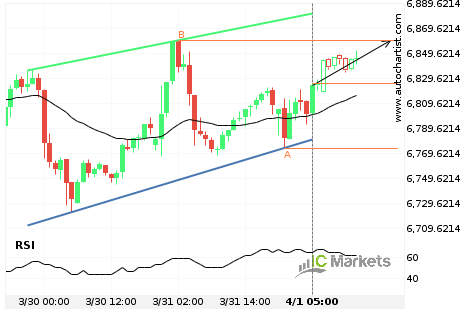
Will Australia 200 Index have enough momentum to break resistance?
Australia 200 Index is heading towards the resistance line of a Ascending Triangle and could reach this point within the next 2 days. It has tested this line numerous times in the past, and this time could be no different from the past, ending in a rebound instead of a breakout. If the breakout doesn’t […]
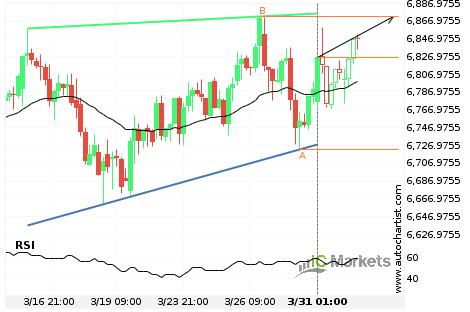